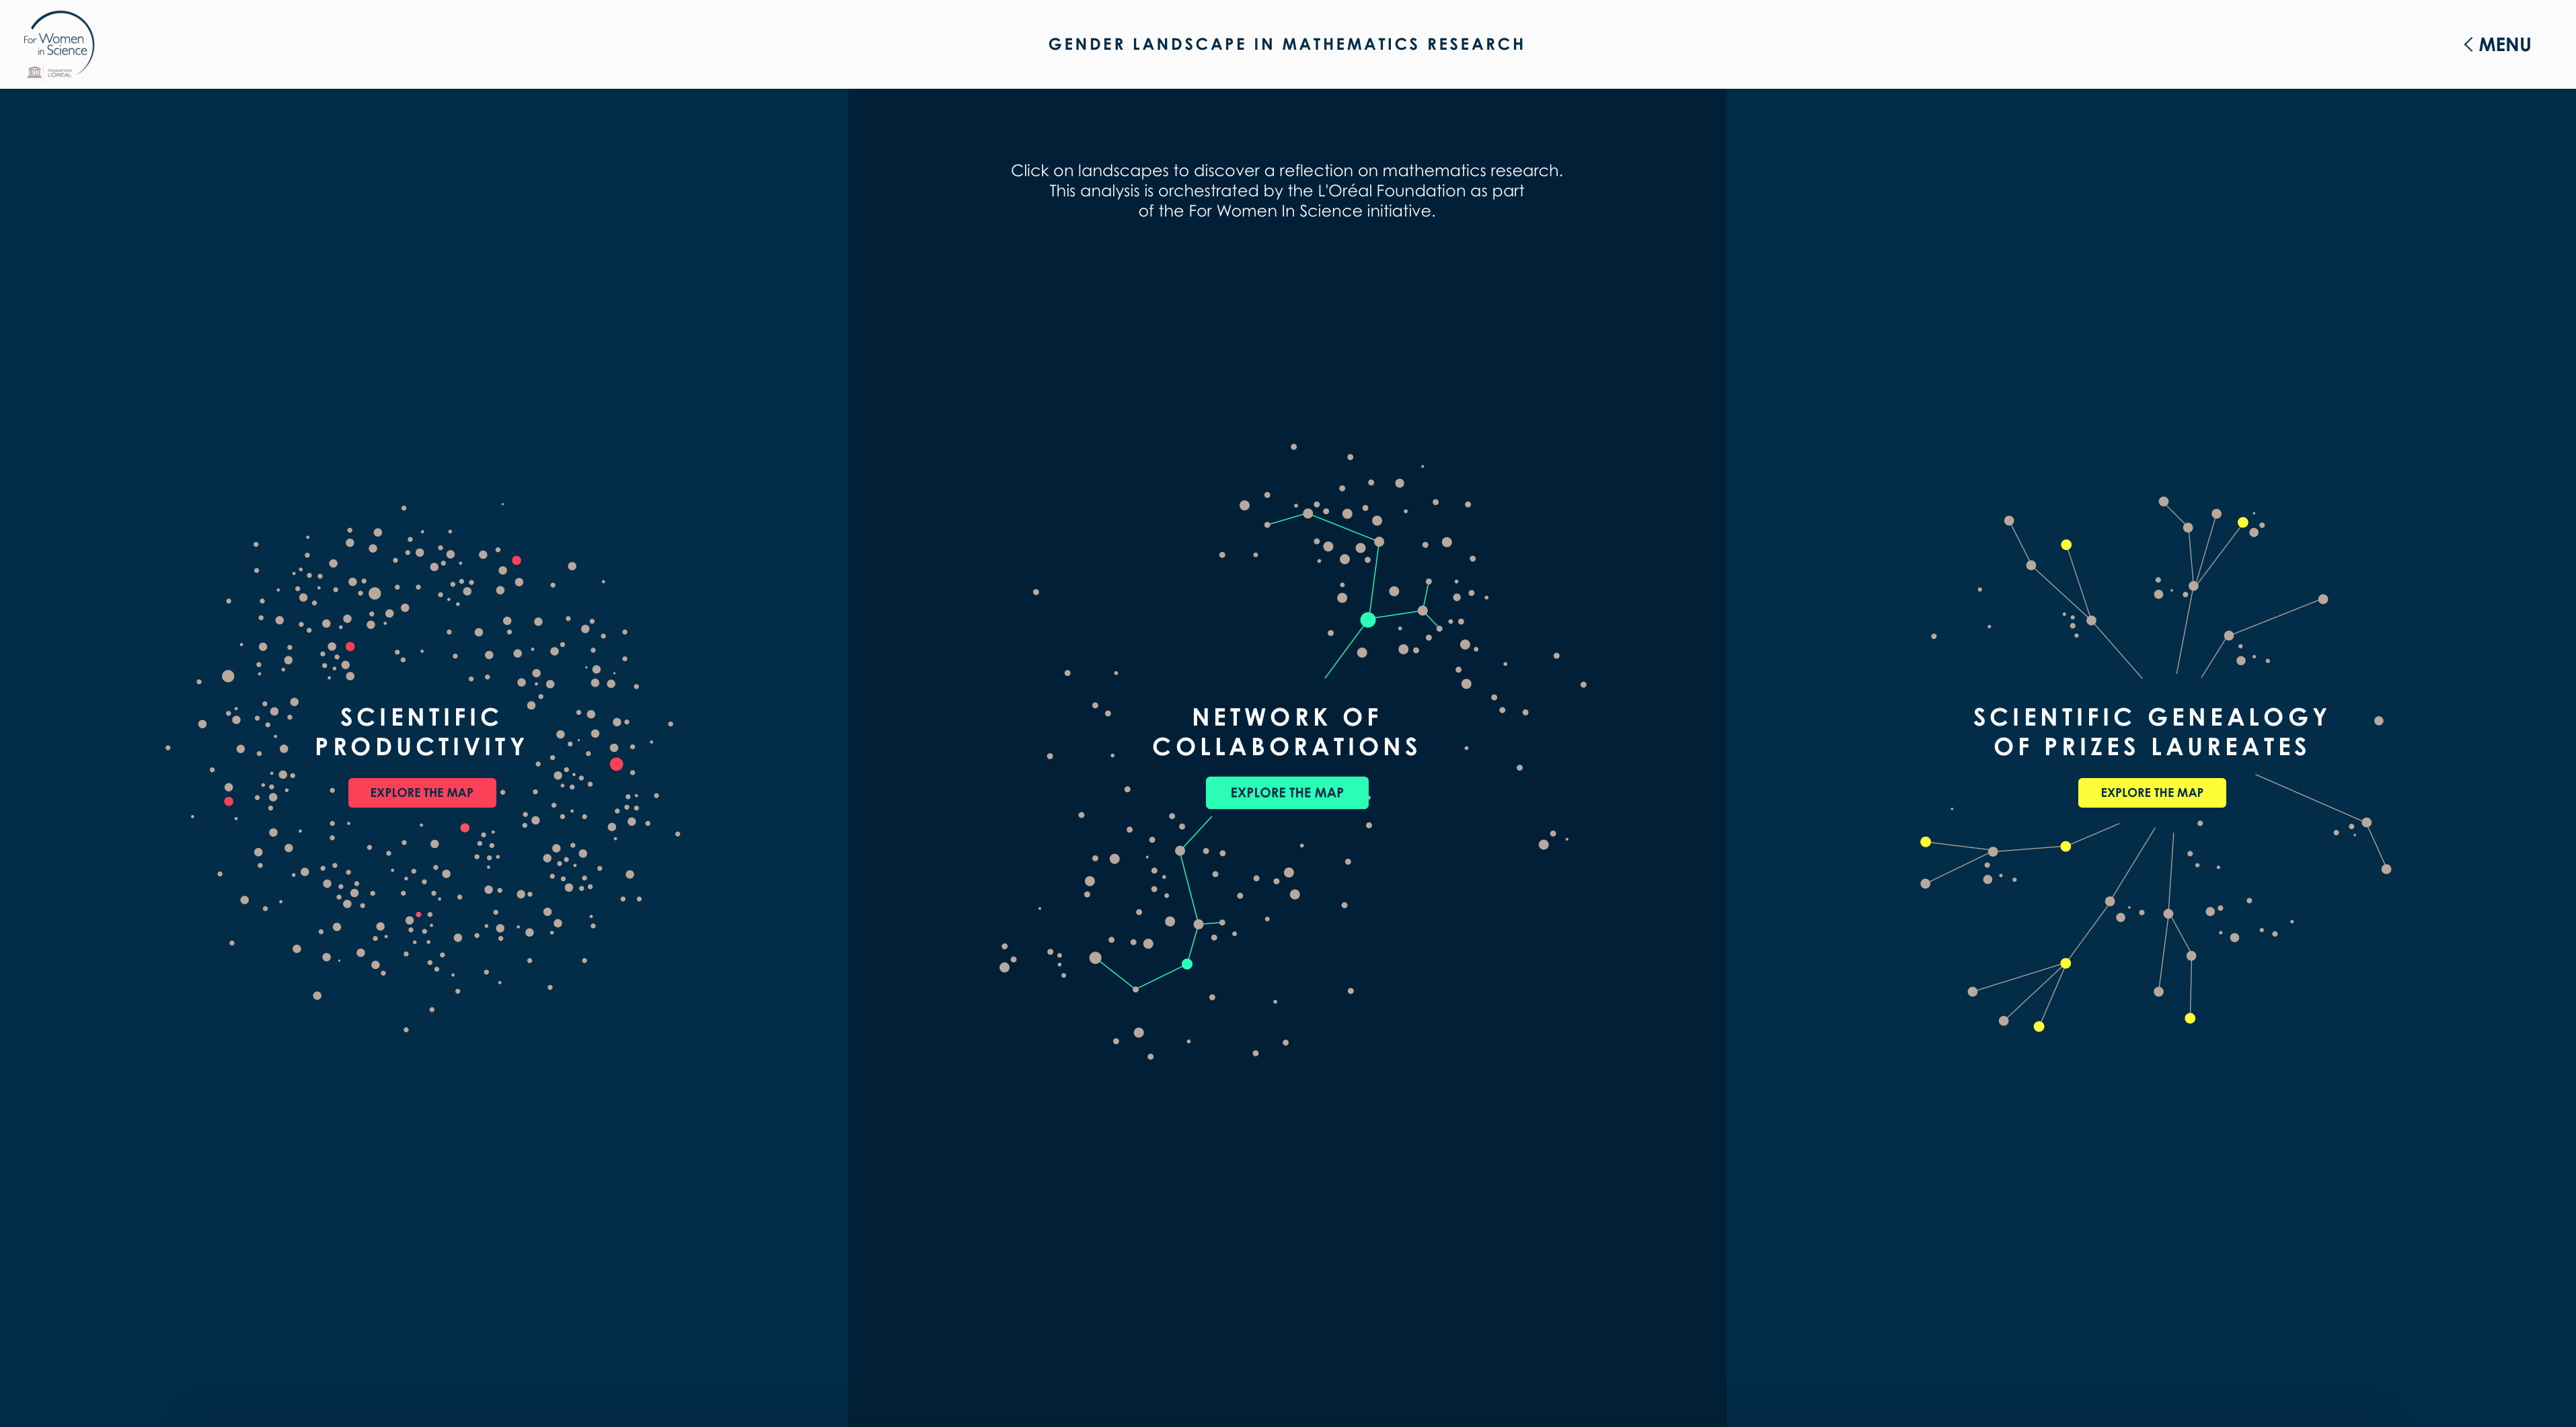
Gender landscape of women in mathematics
Interactive data-visualization
for
L'Oréal Fondation
This is an interactive data visualisation project where I was involved as a developer, as an interactive designer and as a support ux designer. The client of this project is the L’Oréal Fondation. Its department For women in science aims at promoting the involvement of women in scientific research and wants to highlights the gender gap that is appalling in many scientific fields. For this project the focus was on mathematics.
The team
- Project manager - Francesca Sconfienza
- UX design - Camille Vincent, Karim Nasri
- Visual design - Mélissa Vincent, Cindy Renard
- Interaction design and development - Thomas Garnerone, me
My tasks
- Data engineering
- UI development
- Interactive design
- UX design support
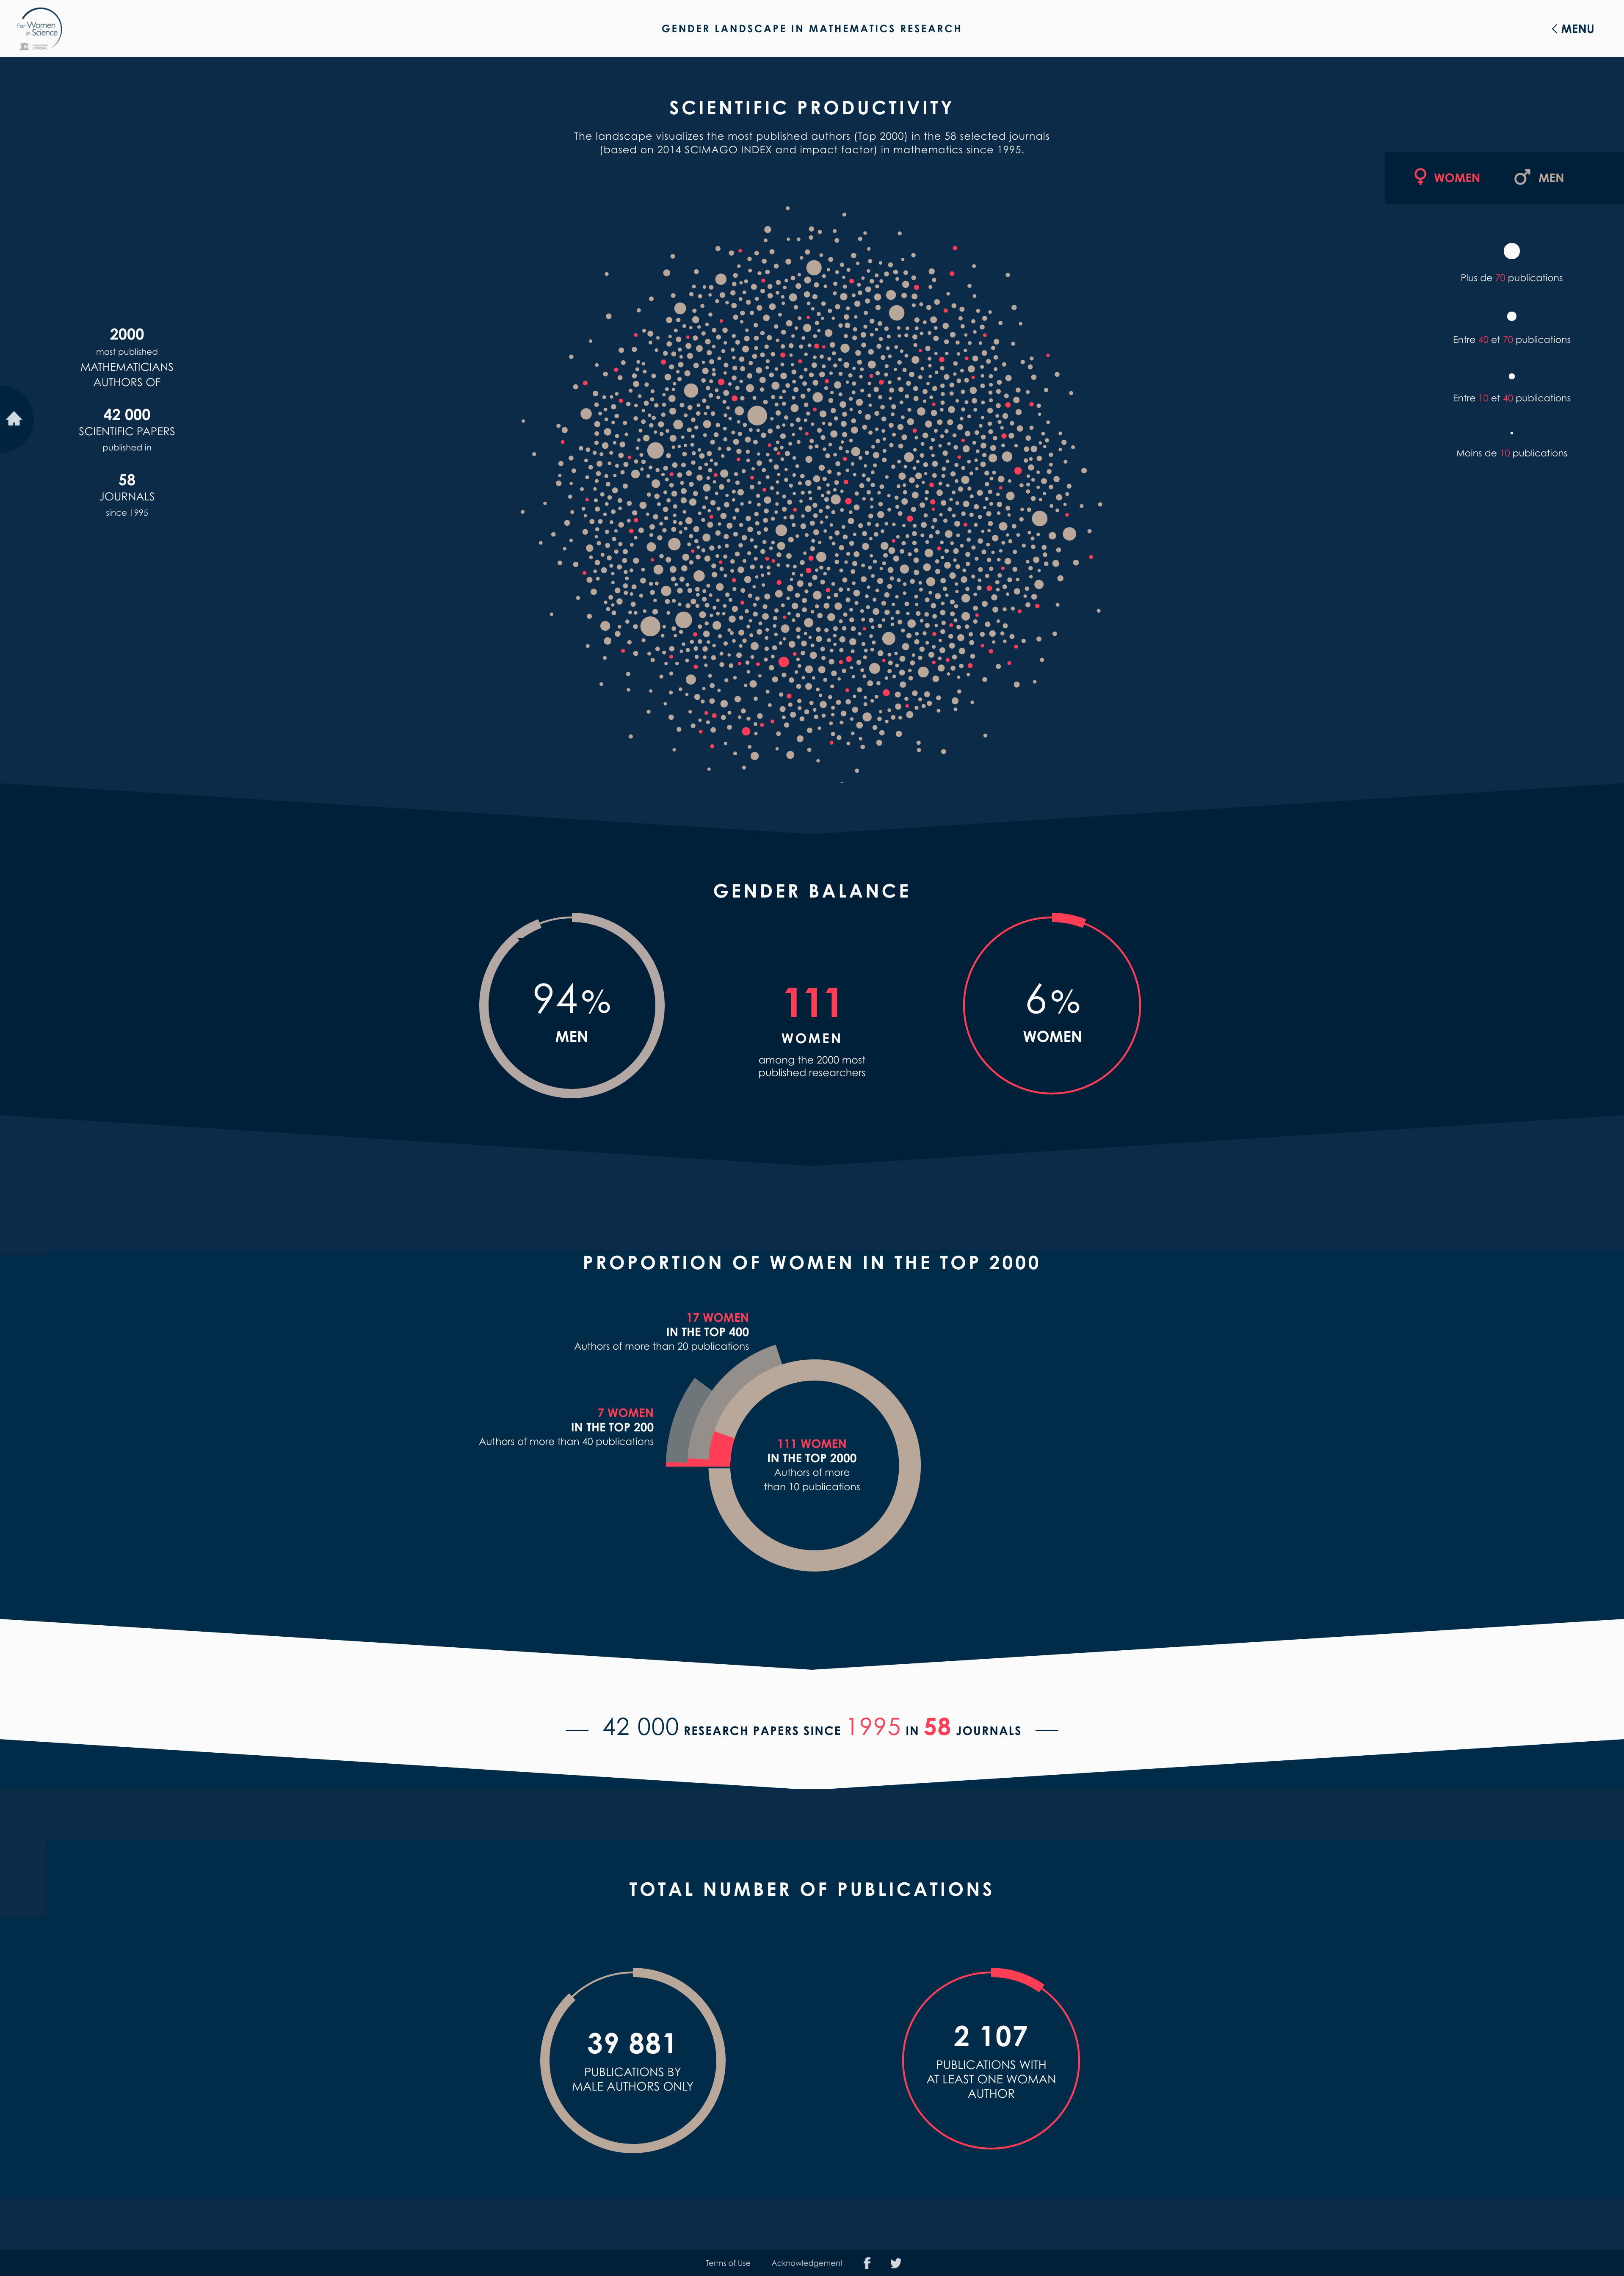
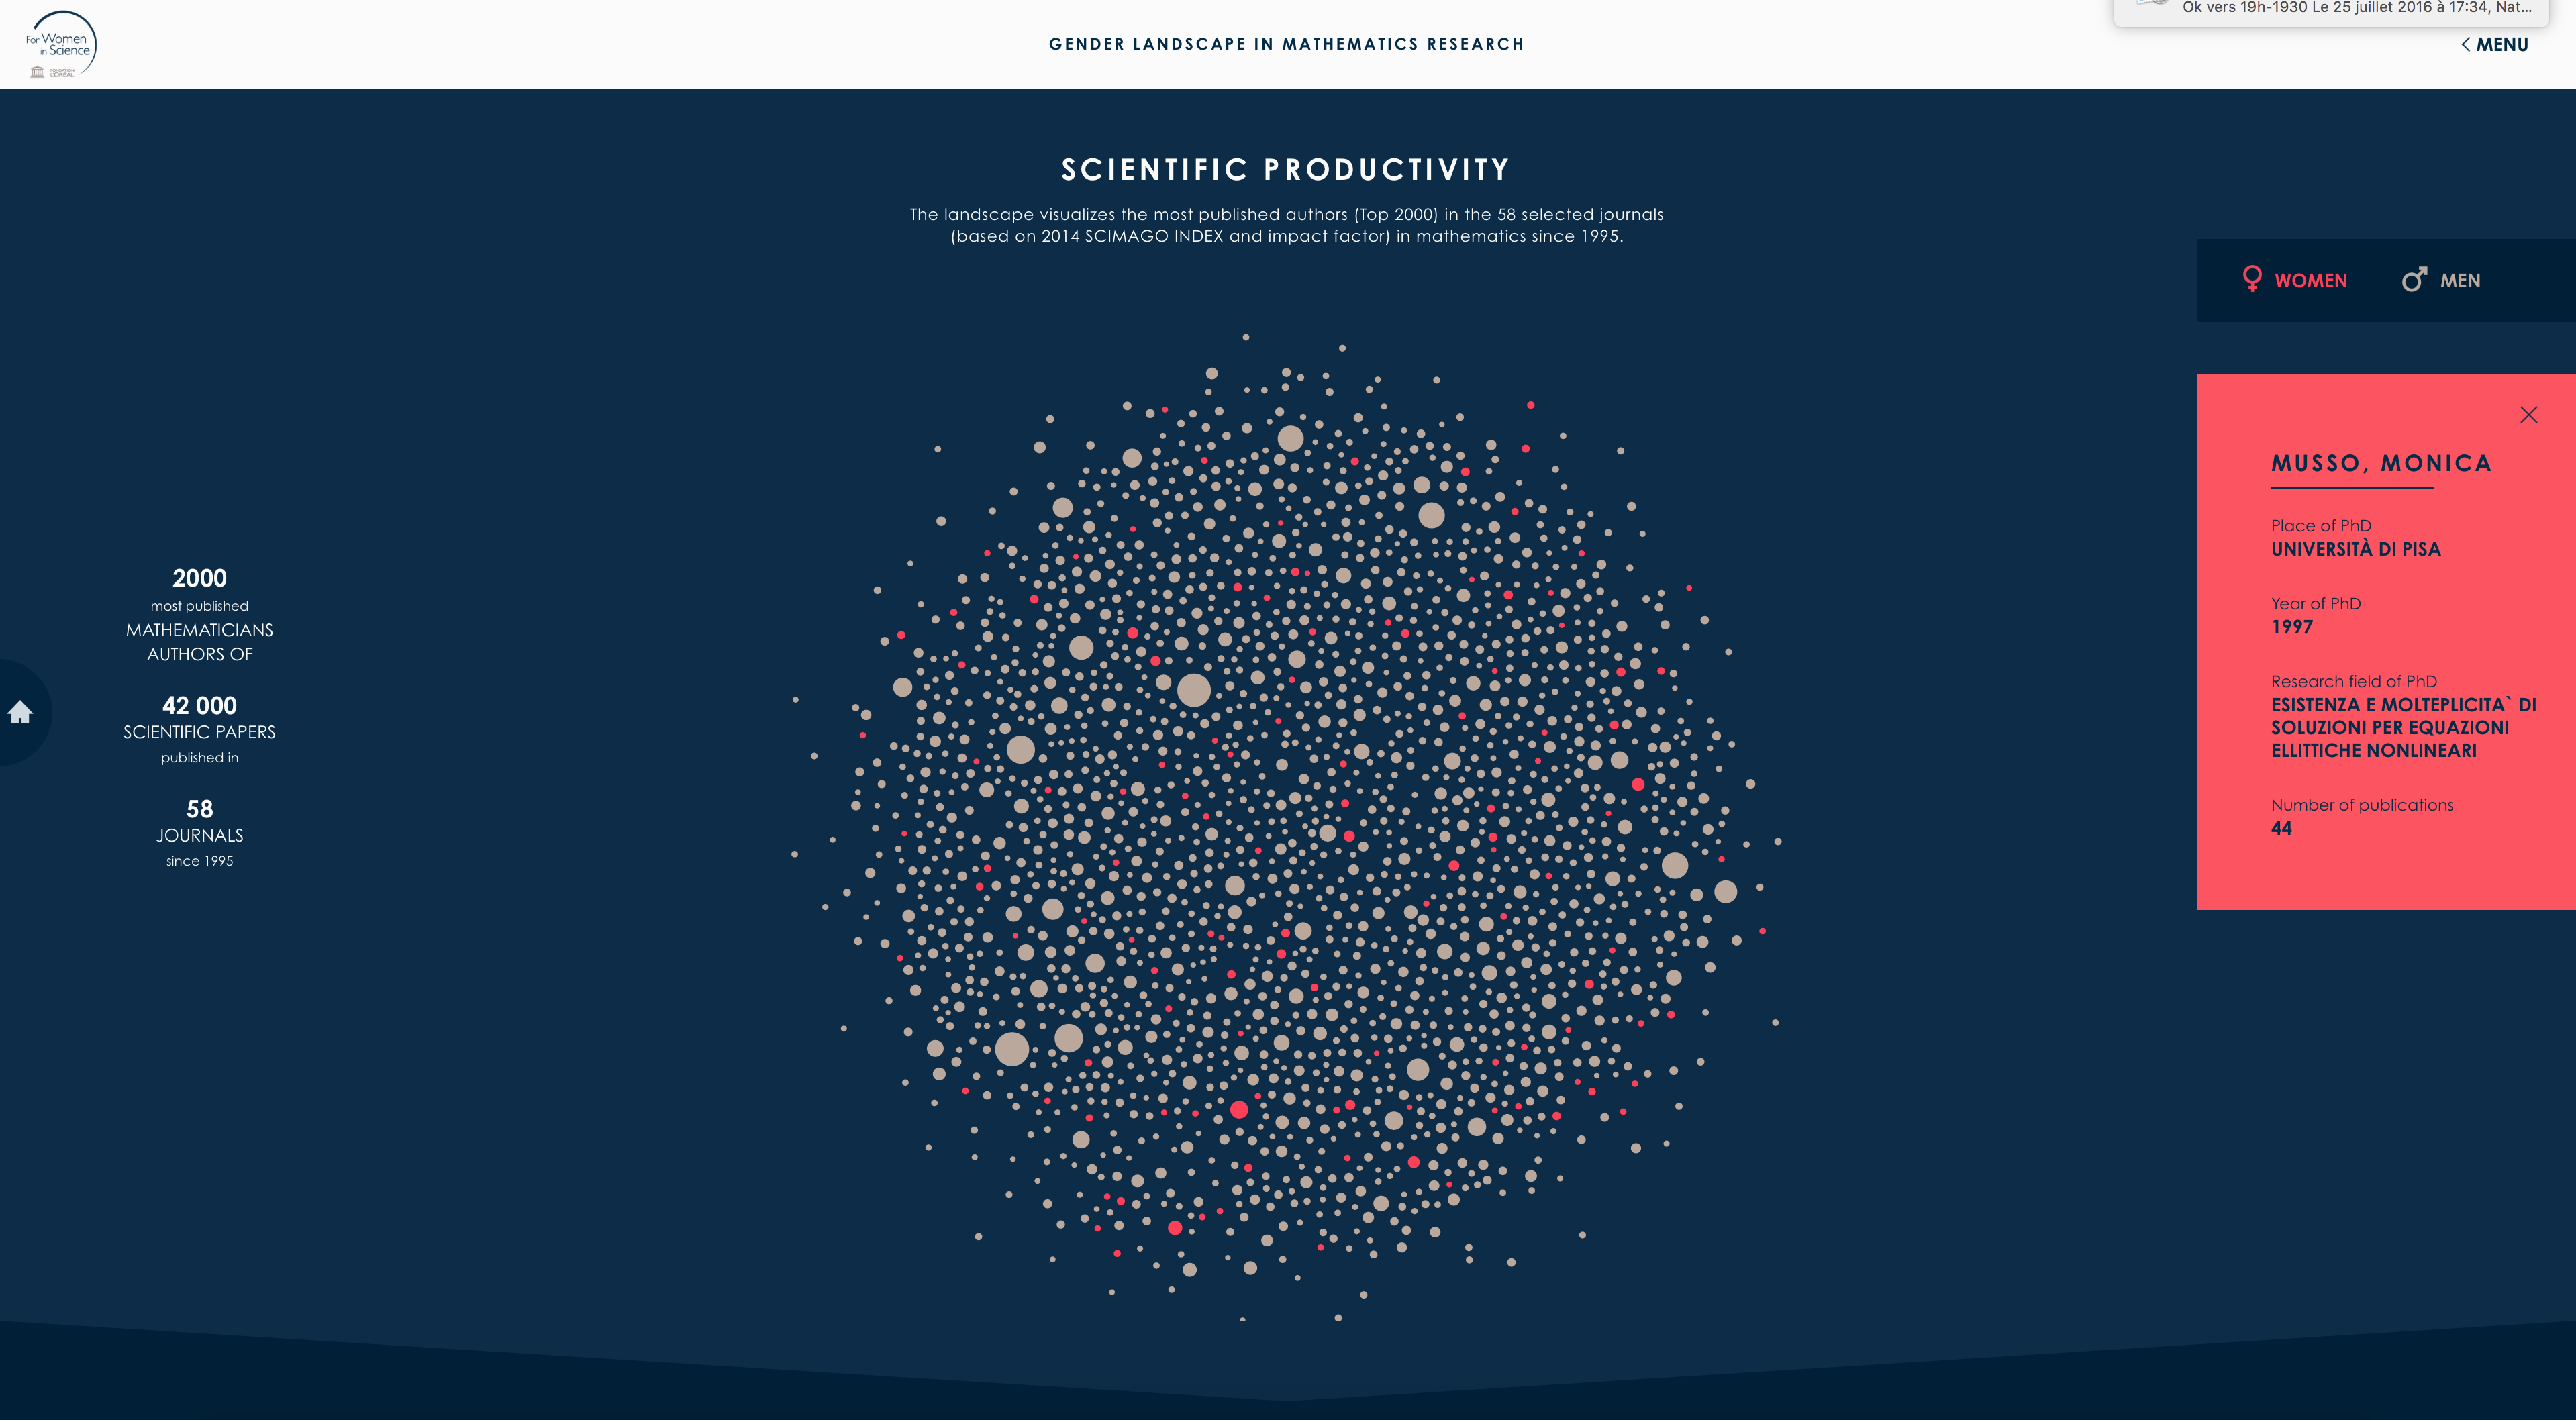
Publication map
This page contains at its top one of the three maps developed for the project. It shows with a random positioning all the most published mathematician researcher. The women are coloured in red while men appear in golden-grey. By clicking on a women you can see an information cartel about the researcher popping up on the right of the screen. The rest of the page shoes information related to the gender gap among the most published mathematician researchers.
I built the constellation map and the interaction that goes with it thanks to raphael.js.
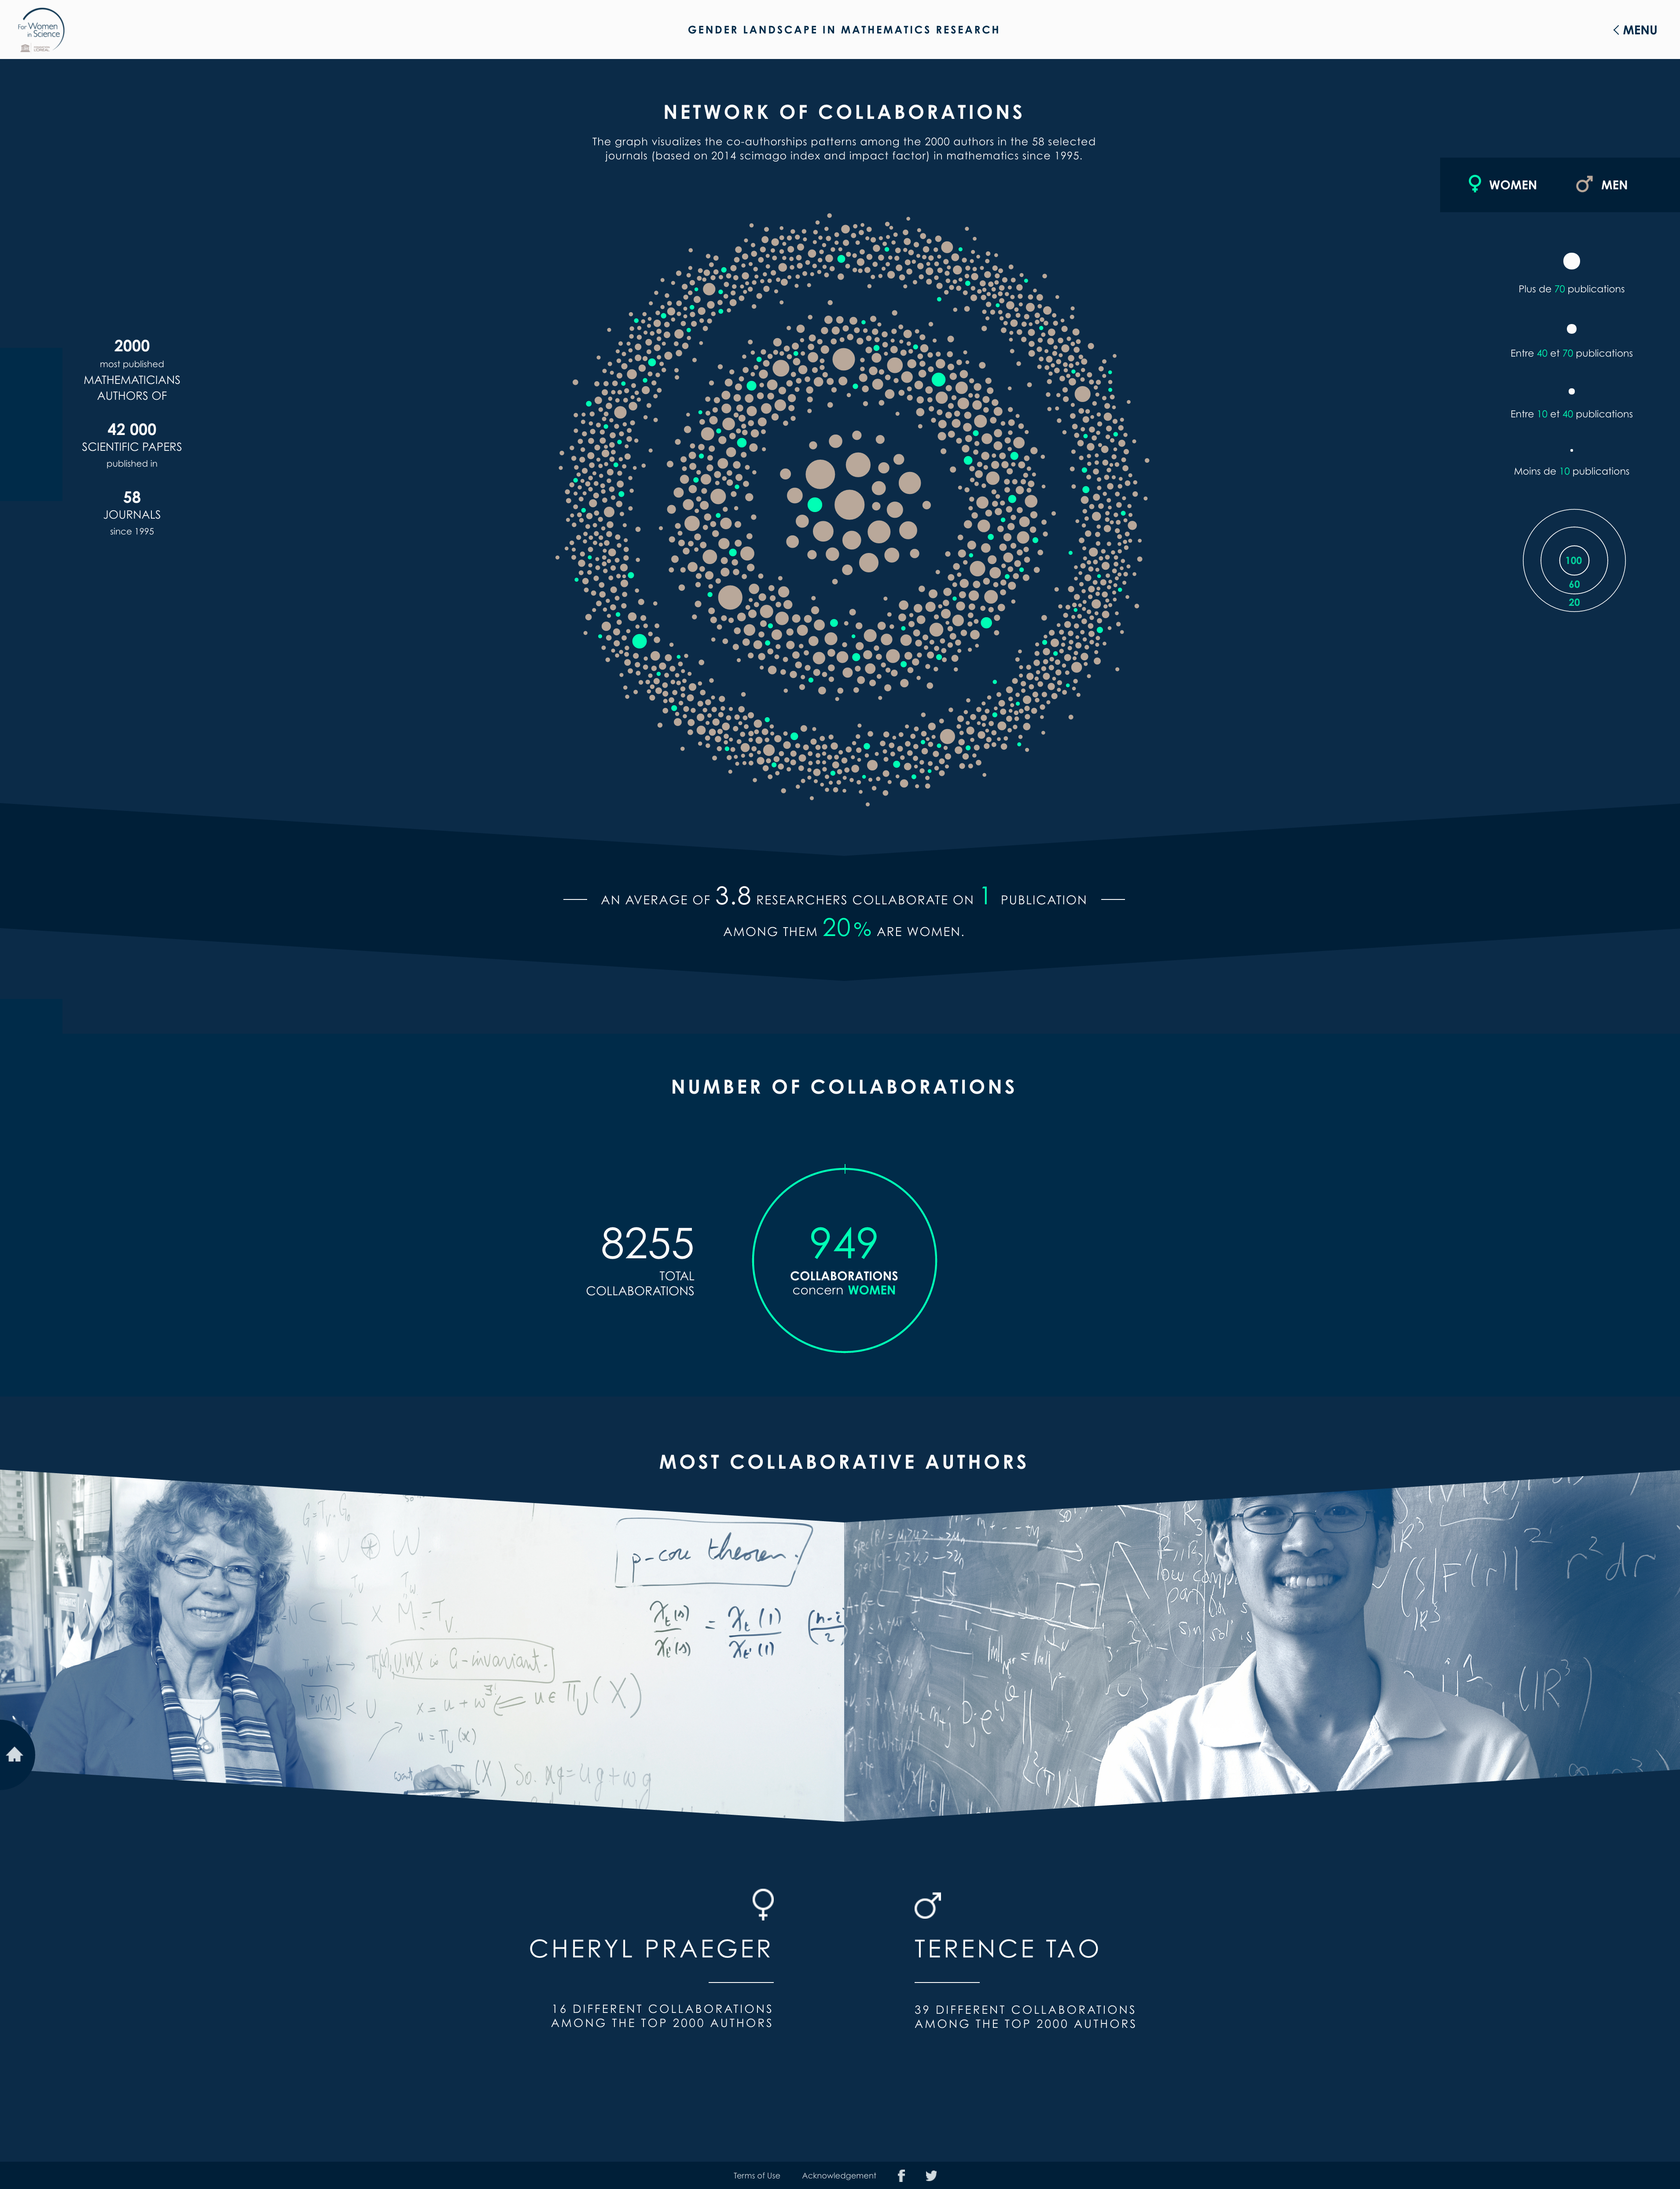
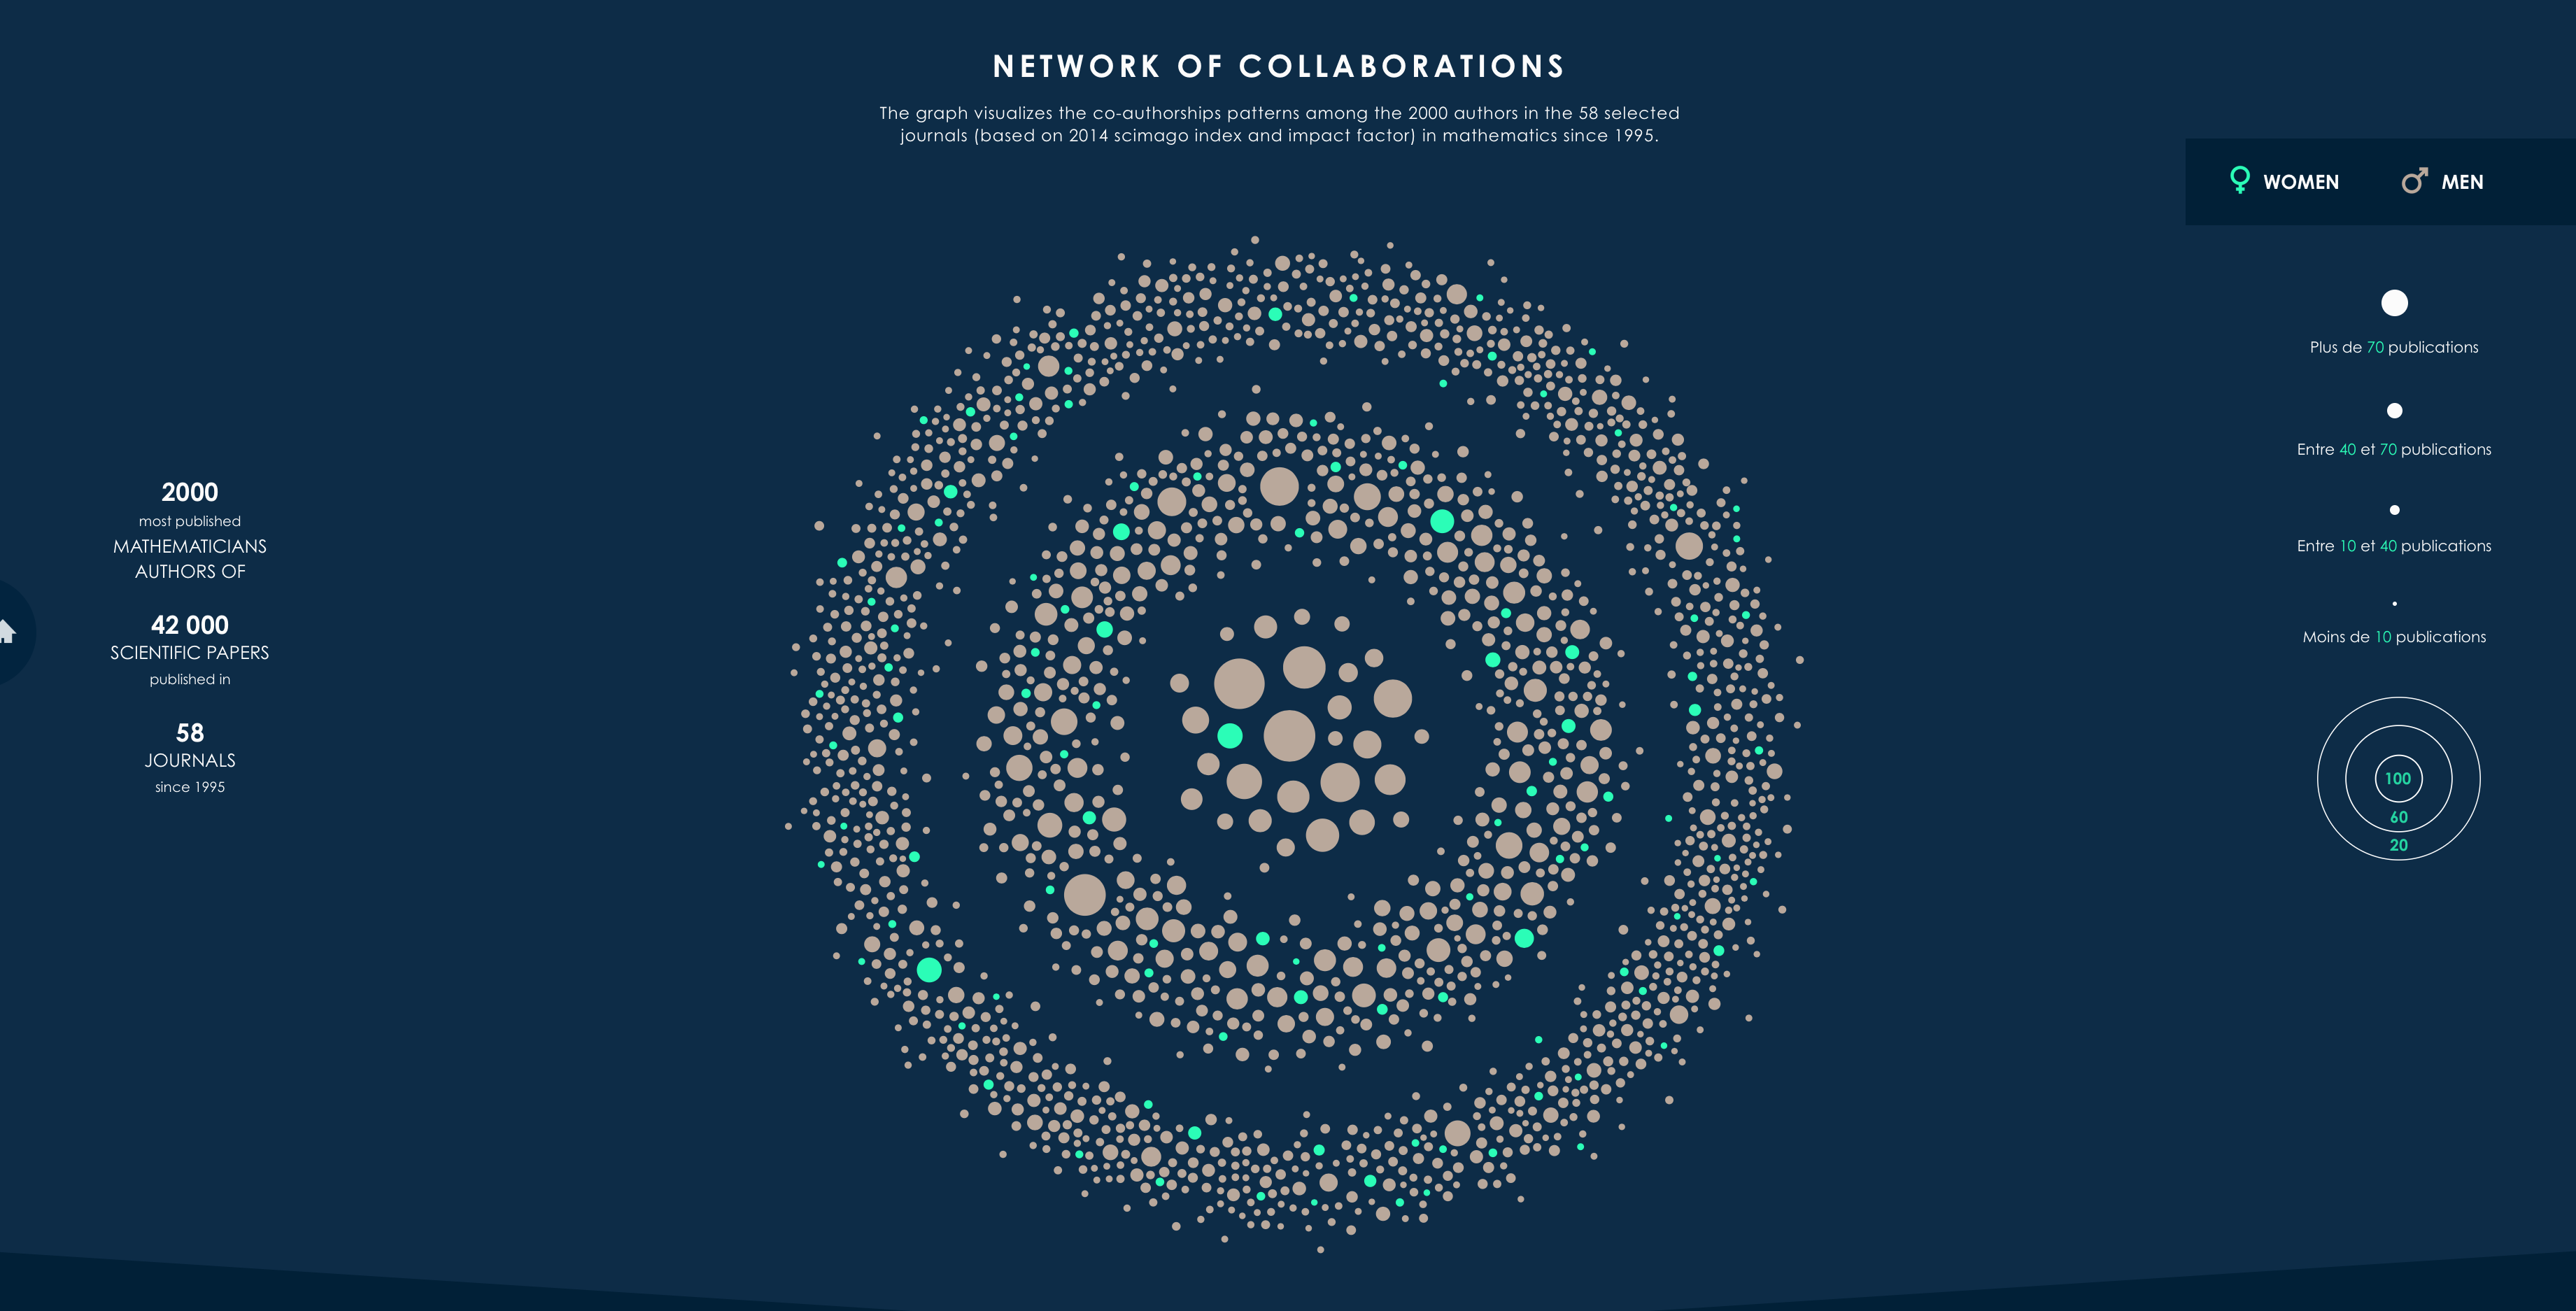
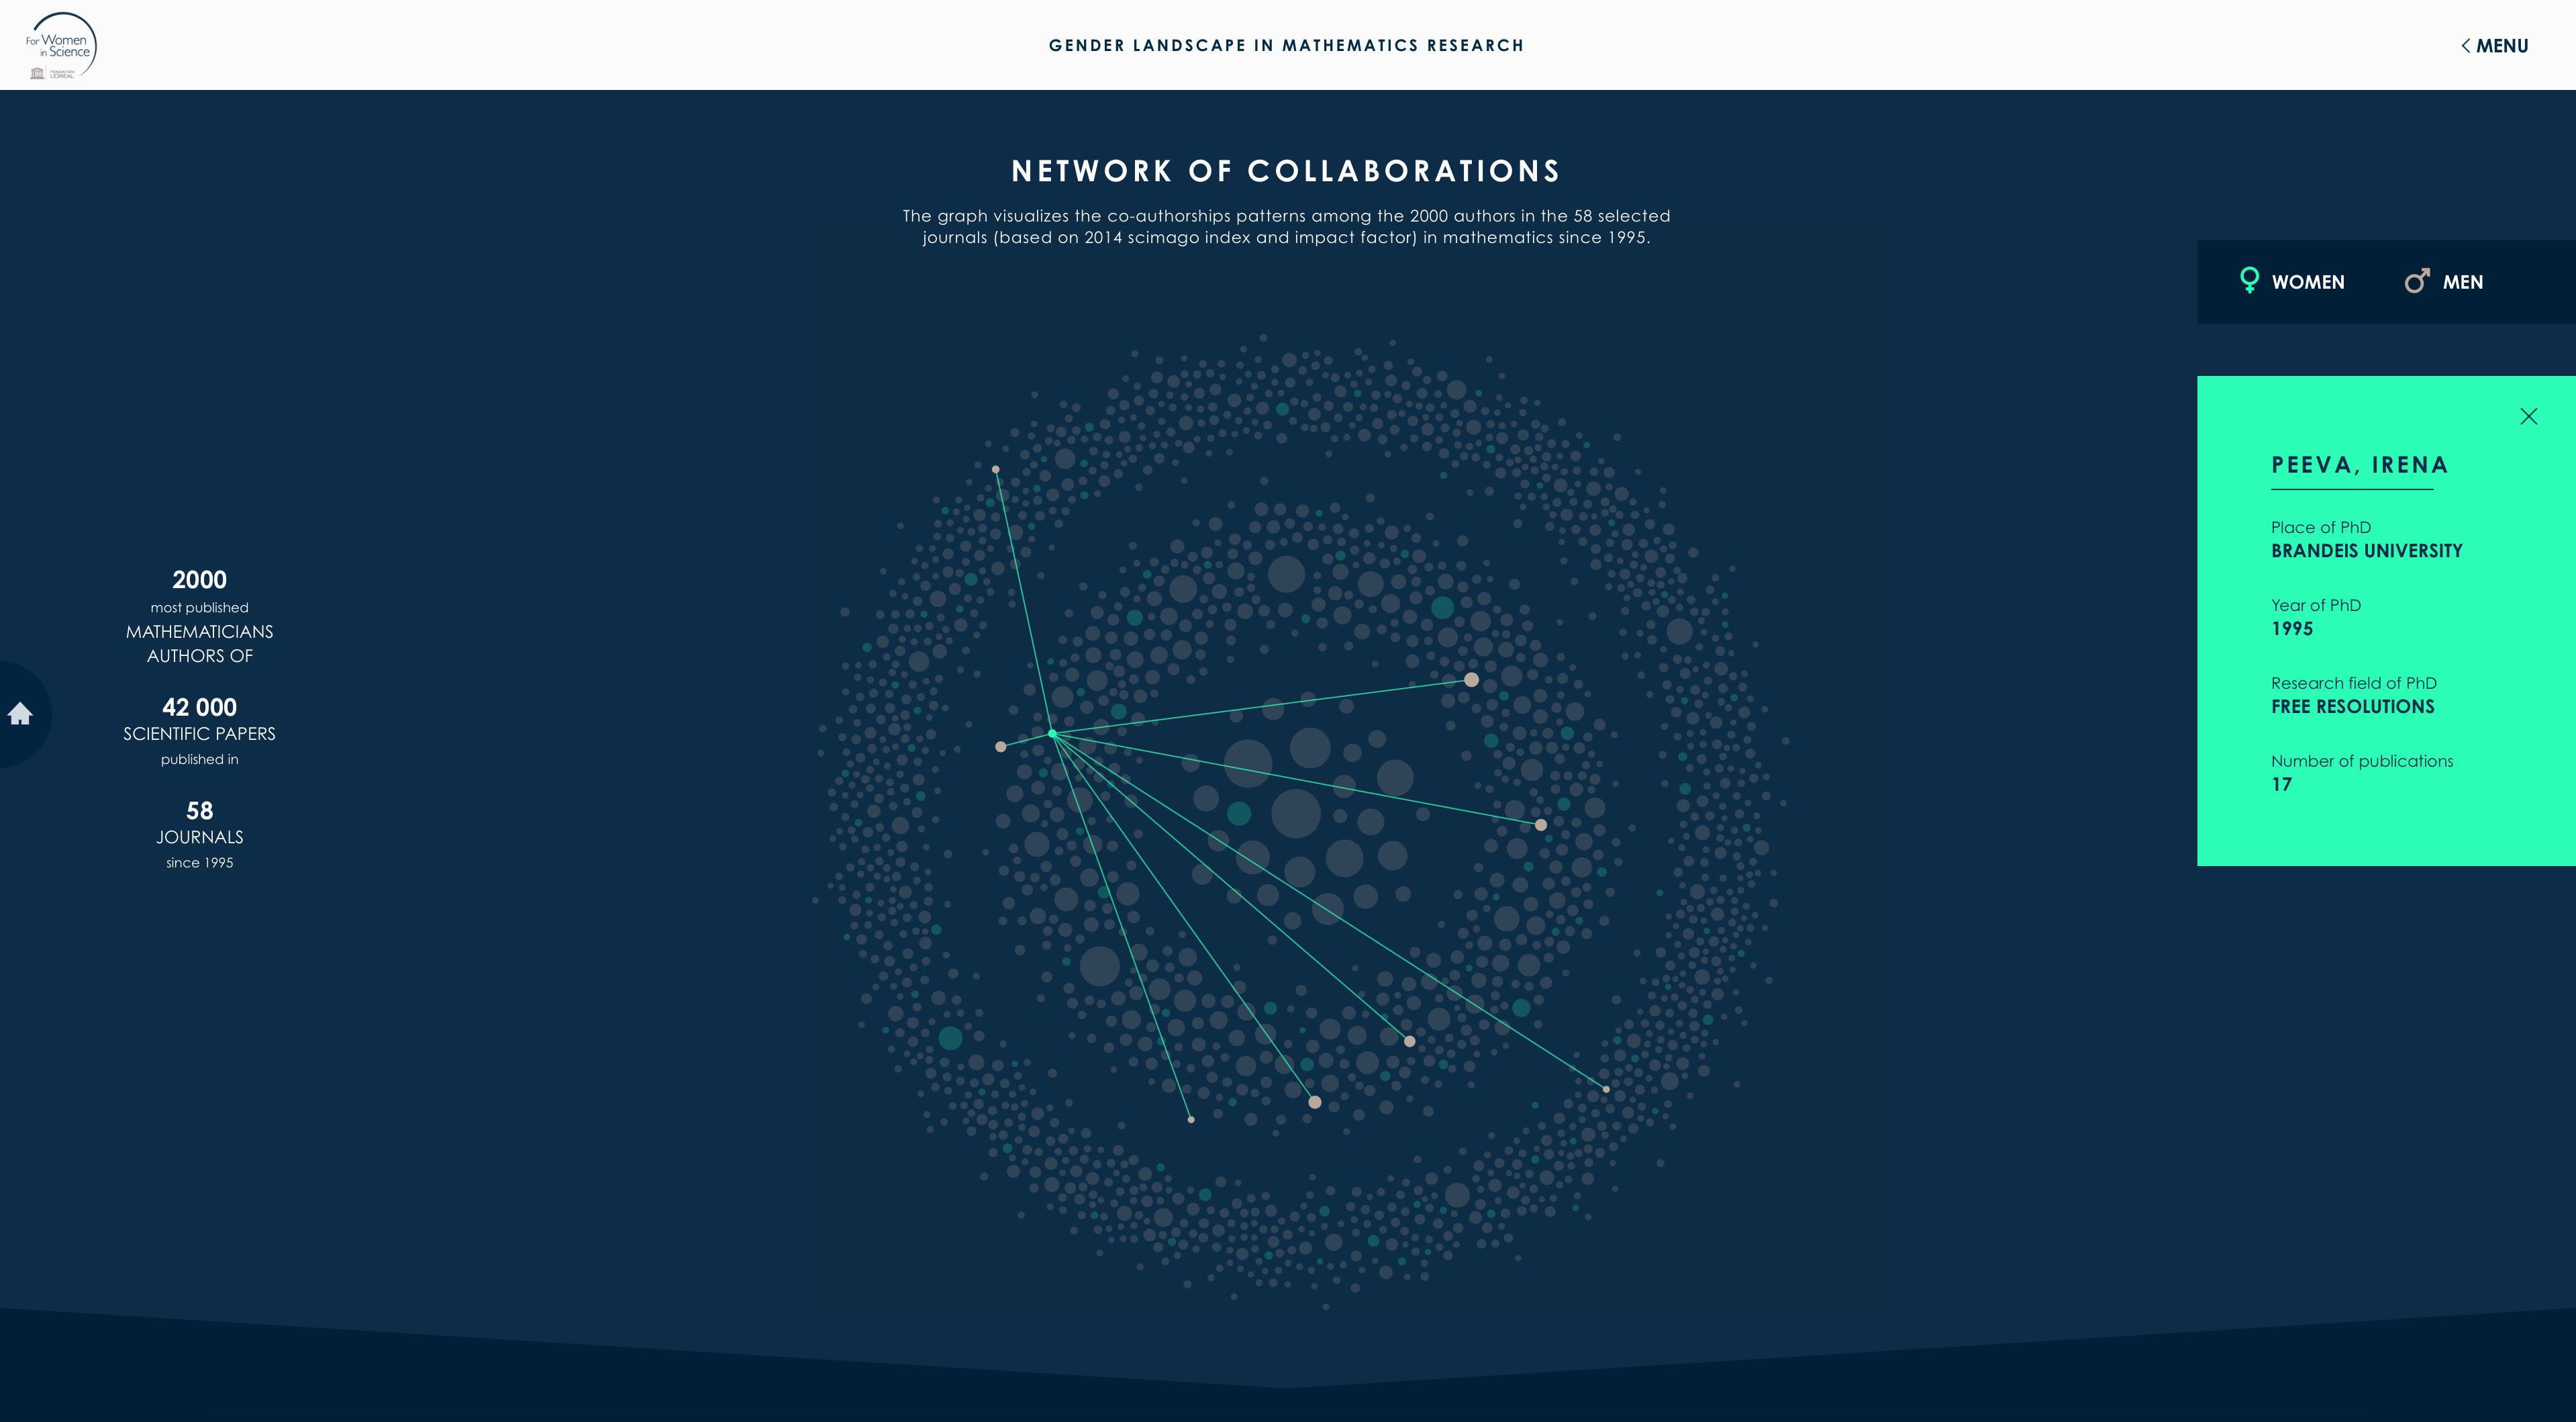
Collaboration map
On this second main page, you can see the collaboration between the most published researchers already seen in the first map. Only the woman, represented in green here are clickable. The user can then see their network of collaboration. This networks takes the shape of a constellation (cf. picture on the top).
To build this map the researchers had to be differentiated with their number of collaborations. The most collaborative are in the center. This positioning was the first challenge. The second challenge was to build a graphic network of collaborations, this was done thanks to recursive algorithms browsing in breadth the data that can be read as a graph. The algorithm extracts a subpart of the graph and transforms it into a tree. The constellation is then graphically generated thanks to raphael.js.
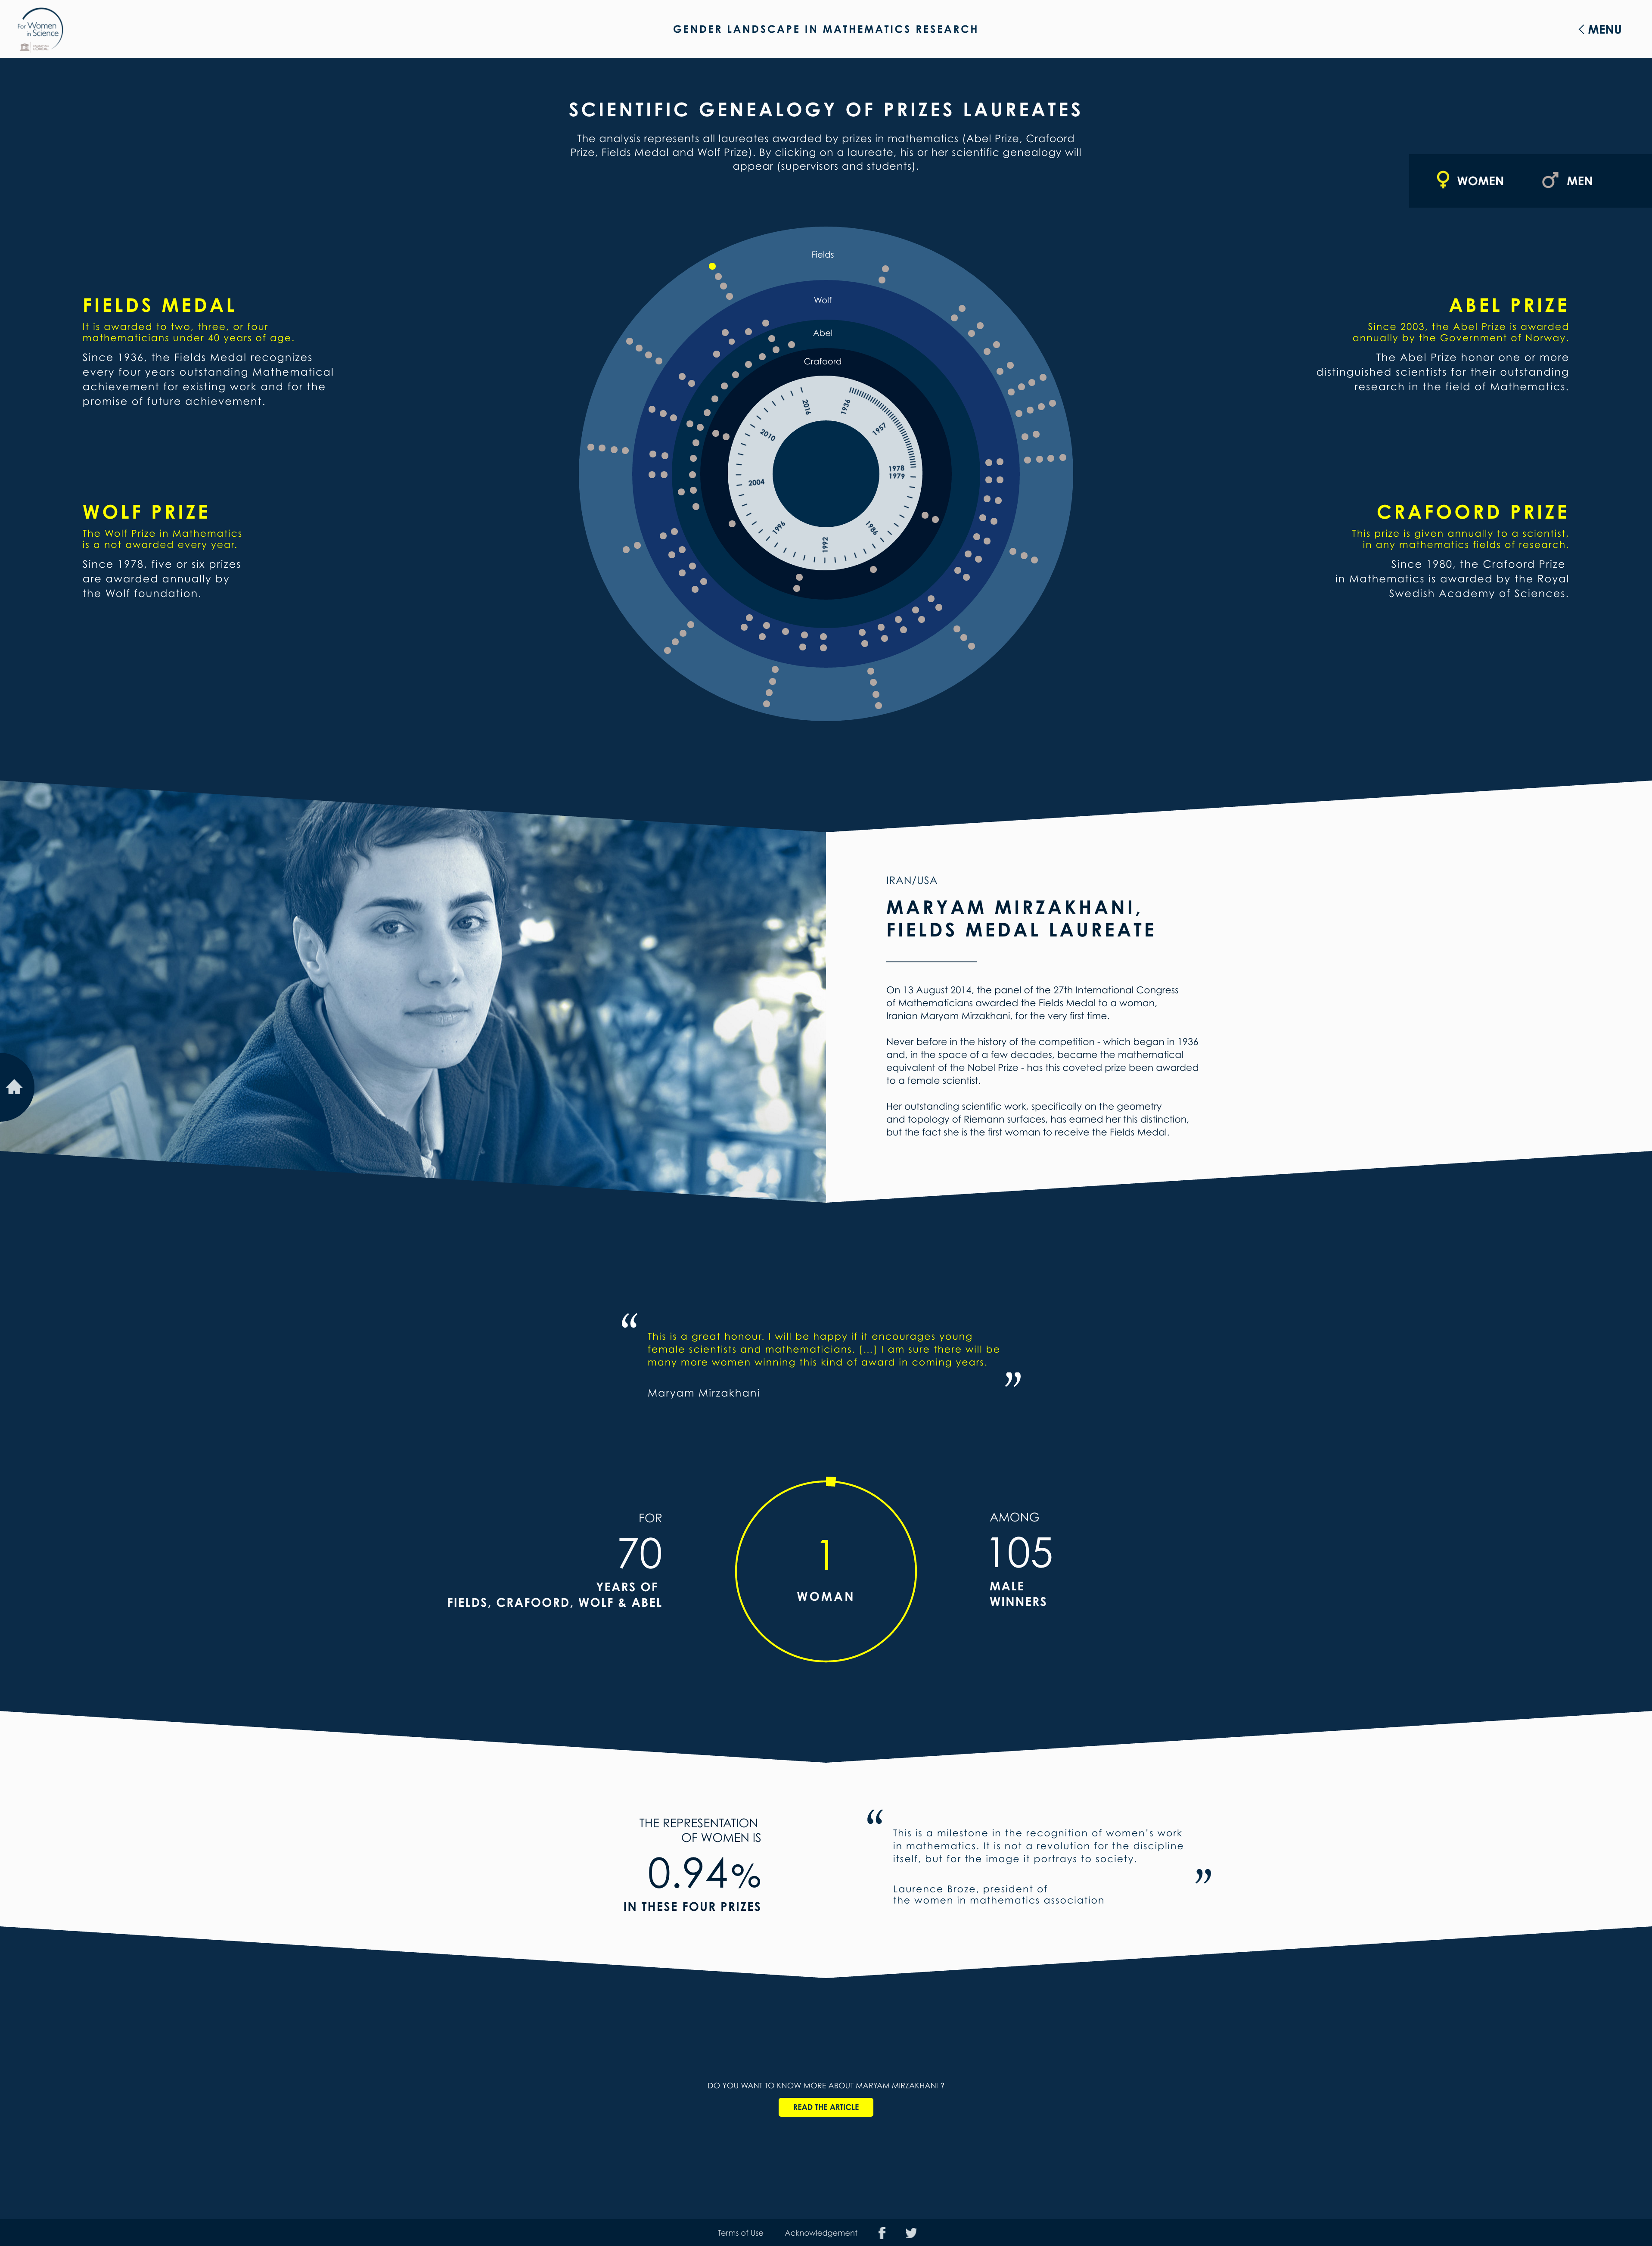
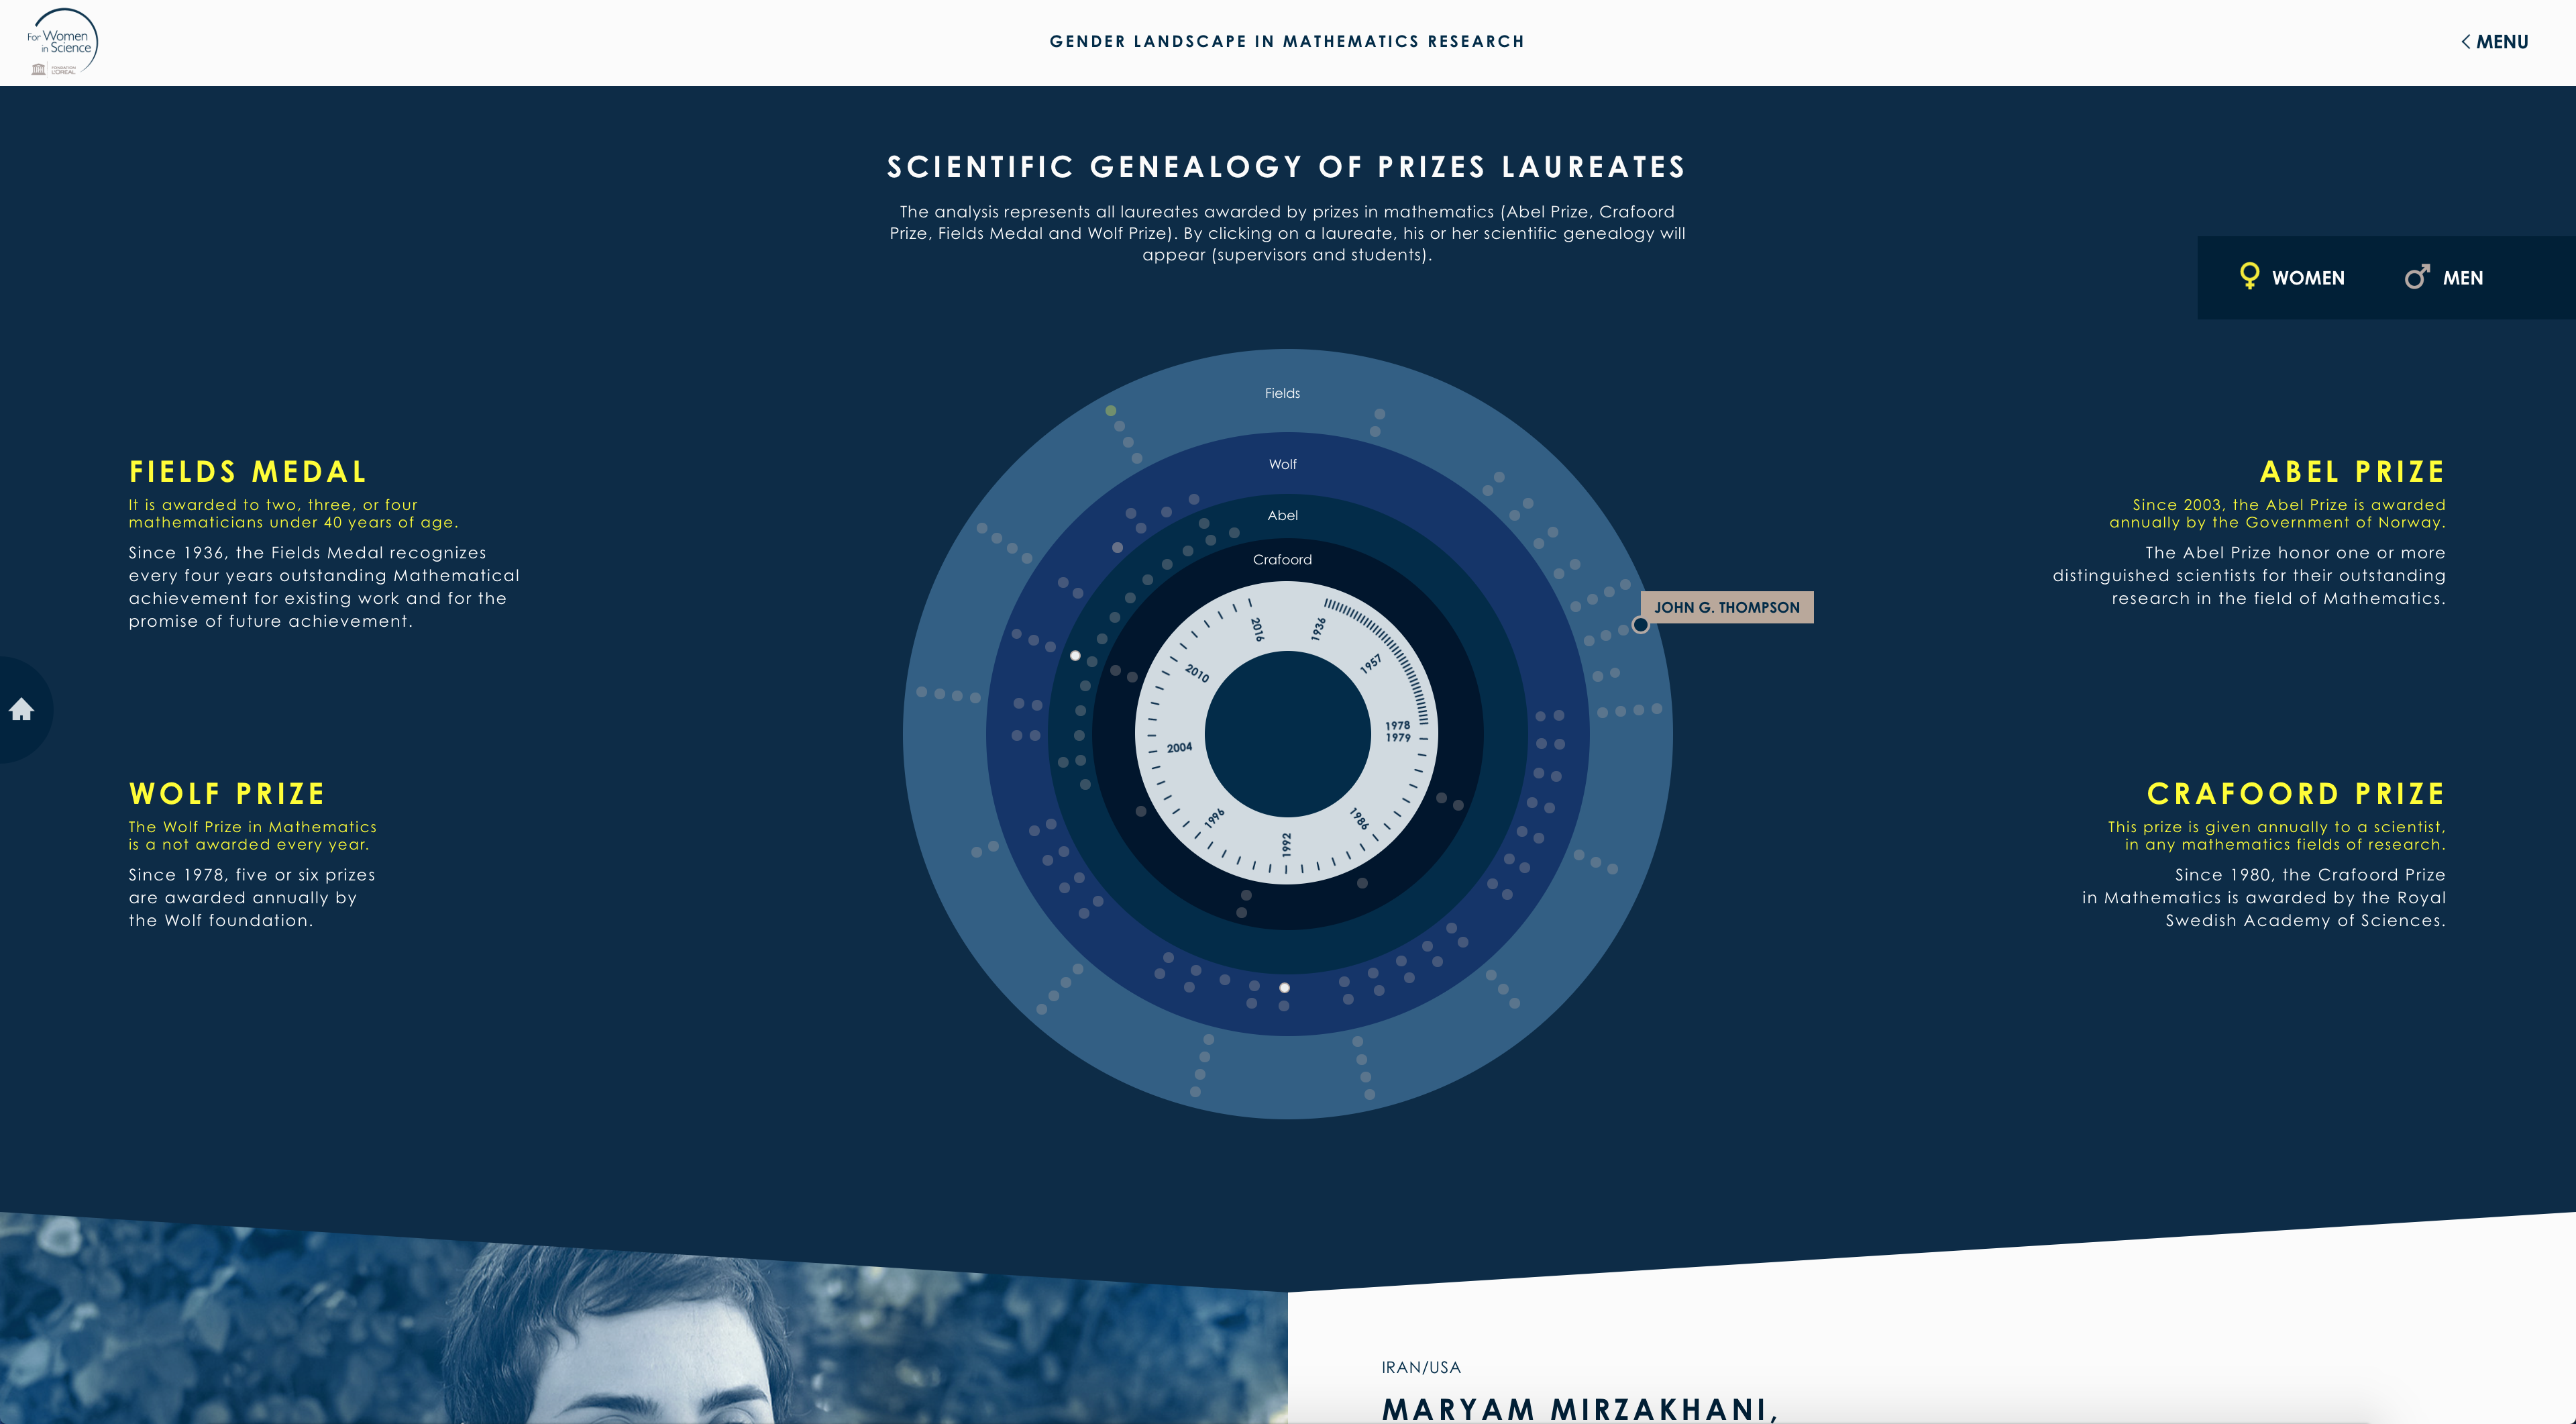
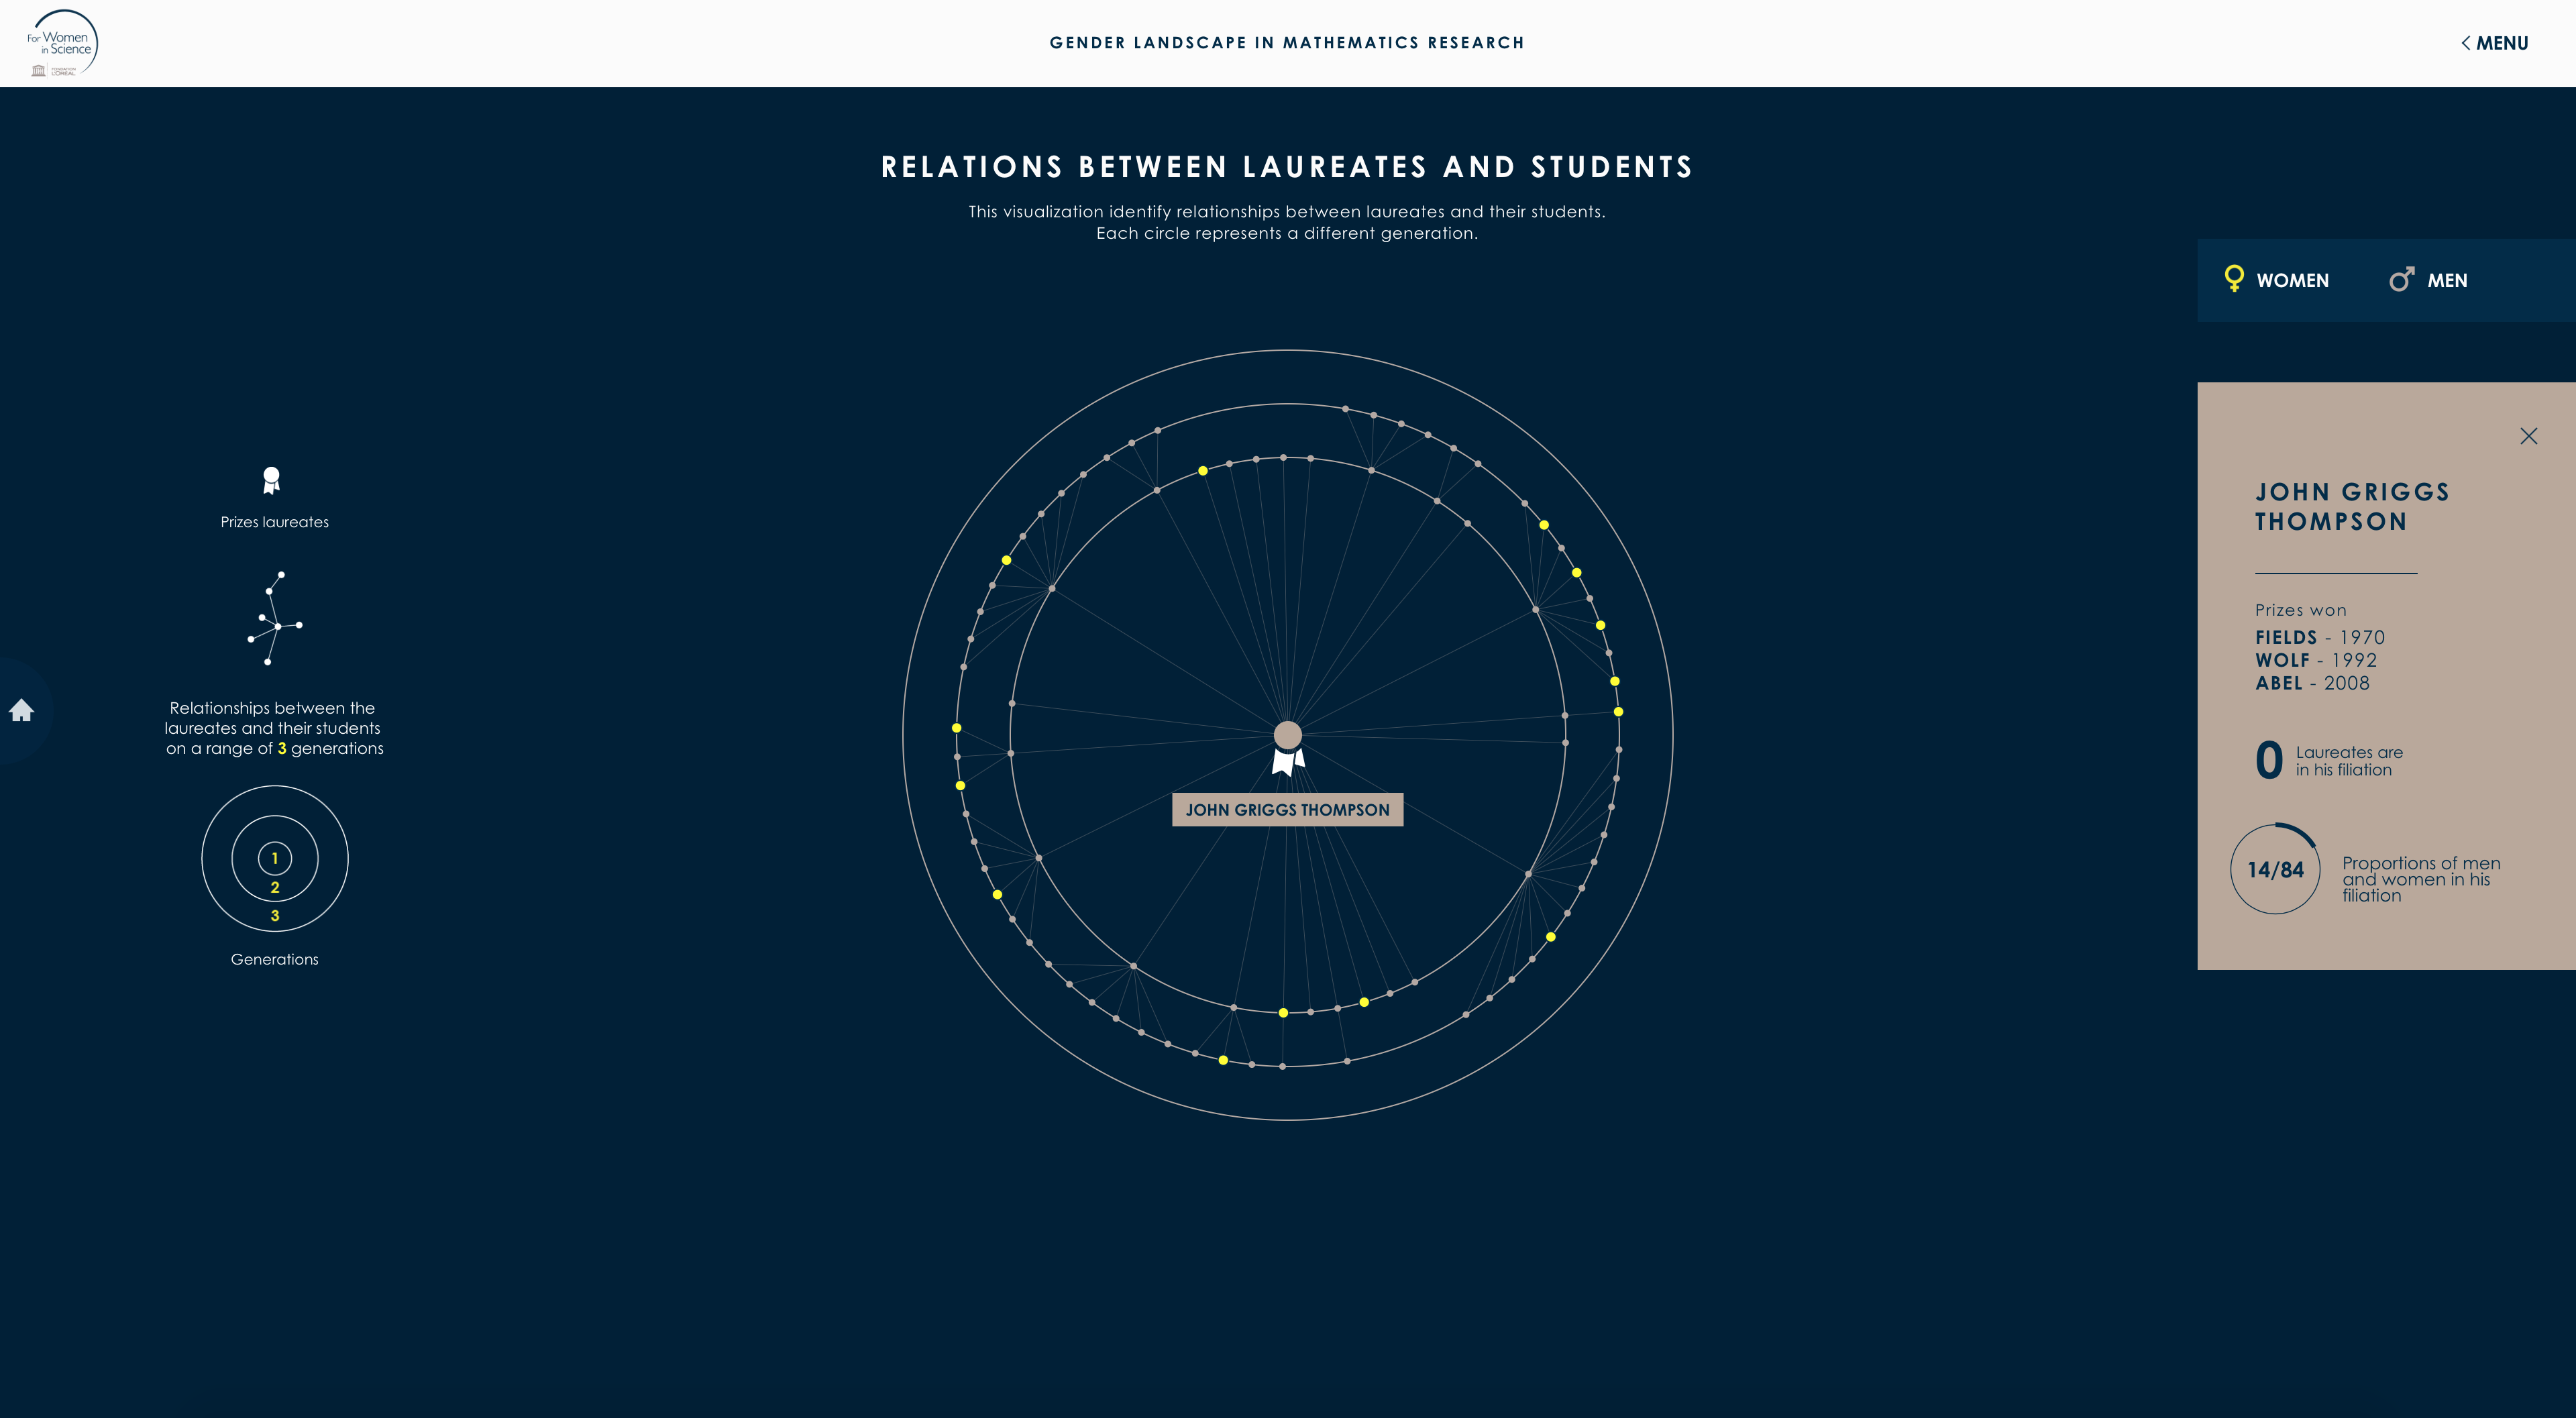
Genealogy of prizes
The third main page focus on the genealogy of prices in mathematics. It shoes the presence of women in the filiation network of researchers who received a price. There is a focus on the only women that one a price in mathematics ( the field medal ), Maryam Mirzakahni. All the dots on the graphic on the top represent a laureate. If you click on it you can see its network of filiation.
This map was the most challenging one to design and develop. The network of filiation displayed after clicking on one of the dots is the graphic representation of a tree that as been extracted from a graph. The used set of data is different than for the first two maps. The graphic transformation was complicated because some of the generated trees contains really a lot of nodes.
Some other views