Seine numérique
Print data-visualisation
for
Sciences du design
For this project I had to produce a
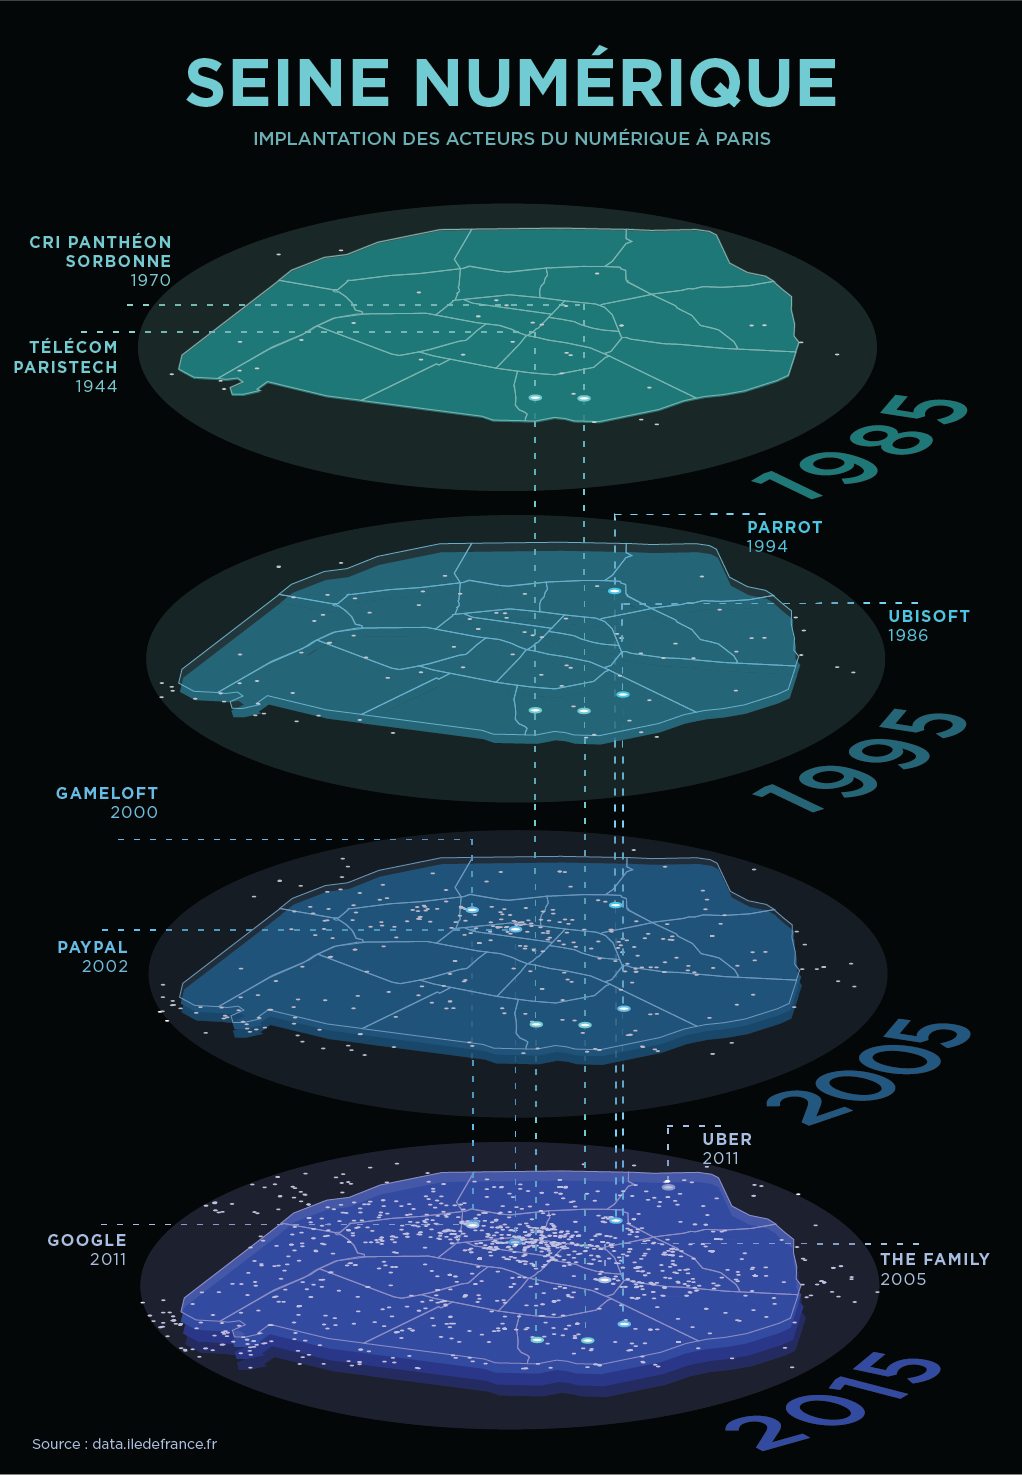
180mm * 260mm page with a data visualization that is related to the subject of urbanism. I had to use open data sources. I choose to show the evolution in time of the new technology economy in Paris. I used data from data.iledefrance.fr . I worked with d3.js to retrieve the data from the json source document. I projected all the tech companies locations as a white dot onto the map canvas of Paris. Then I imported an svg file that I modified and improved within illustrator. I collaborated with Thomas Garnerone and Karim Nasri.